



Thirty-seven years of the same grid, from a monochrome screen on a Compaq to a browser tab. Watch two things as you scroll: the free memory readouts in the early About boxes, and how long it takes the software to start asking who you are.
Microsoft Multiplan (1982)
Before Microsoft Excel existed there was Microsoft Multiplan, built to fight VisiCalc and released for nearly everything with a keyboard: Apple II, CP/M, MS-DOS, Macintosh, Xenix, Commodore 64, TI-99/4A, TRS-80. The splash screen is a great relic of the time: For Compaq Personal Computer, printed under the version number.
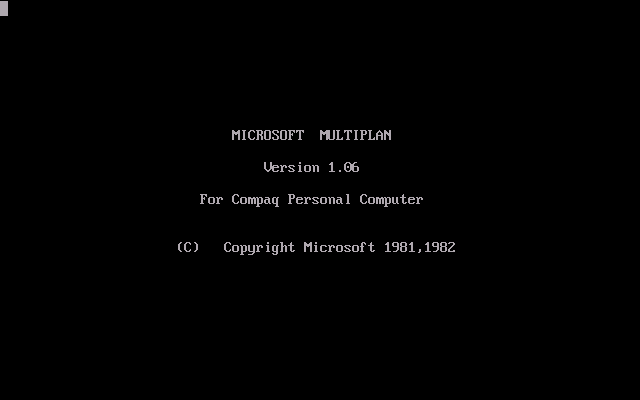
Microsoft Multiplan Splash Screen (1982)
Source: winworldpc.com
Then Lotus 1-2-3 reached the IBM PC in 1983 and took the IBM PC market away from Multiplan so decisively that Multiplan never recovered on that platform. Look at the headers below: rows numbered, columns numbered too, because Multiplan addressed cells as R1C1 rather than A1. The indicator at bottom left reads R10C3, where the now-standard A1 notation would read C10. Commands run along the bottom and you type the first letter. No mouse anywhere in this picture.

Microsoft Multiplan Spreadsheet (1982)
Source: winworldpc.com
Microsoft Excel for Mac (1985)
Excel was released for the Mac first, and there never was a version for MS-DOS at all. Version 1.0 arrived in the fall of 1985, while Lotus 1-2-3 dominated spreadsheets on the IBM PC. The About box below is from version 1.5, with an on-screen date of May 19, 1988. Half the dialog is a list of help topics, one of which is Saving Memory.
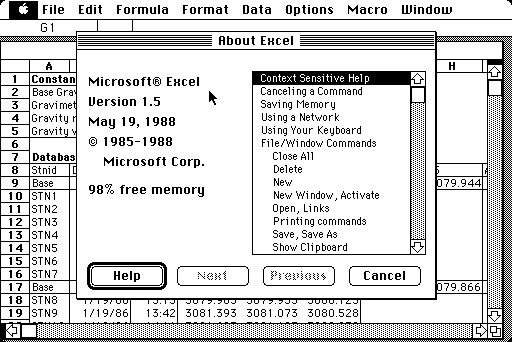
Microsoft Excel 1.5 for Mac About Dialog (1988)
Source: winworldpc.com
The next screenshot is the whole argument for Excel in one frame. Two workbooks open at once in overlapping windows, set in a proportional typeface with bold headings and right-aligned currency. Nothing on a character-cell display could do this.

Microsoft Excel 1.5 for Mac Spreadsheet (1988)
Source: winworldpc.com
Then a break-even analysis in its own window, with the menu bar quietly rearranged to suit it. One bit per pixel, so the five series are told apart by line style rather than color, and somebody has hand-drawn the arrow. Remember this chart.
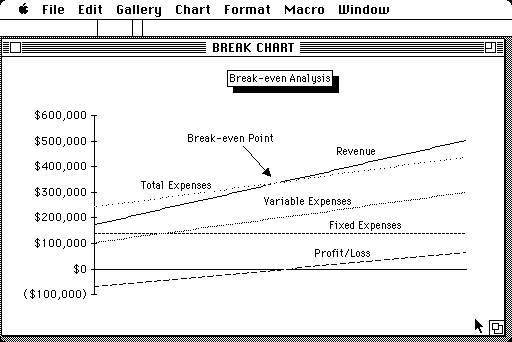
Microsoft Excel 1.5 for Mac Break-Even Chart (1988)
Source: winworldpc.com
Microsoft Excel 2.0 for Windows (1987)
There was never an Excel 1.0 for Windows. Microsoft started the Windows line at 2.0 to match the Mac, and the splash below is stamped October 31, 1987. So few people ran Windows that the box shipped with a runtime copy of Windows inside it, which meant that for a lot of buyers Excel was the reason they had Windows at all. Our history of Microsoft Windows has the other half.
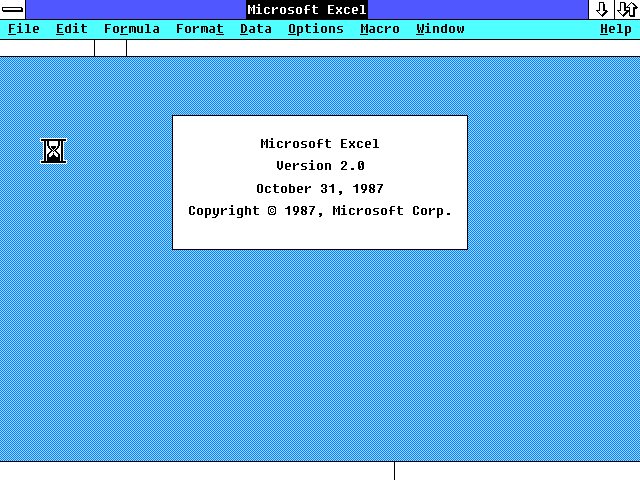
Microsoft Excel 2.0 for Windows Splash Screen (1987)
Source: winworldpc.com
The About box is really a hardware report. Conventional Memory: 77 of 174 KB Free. Math Co-processor: Present. Hold on to that 174 KB.
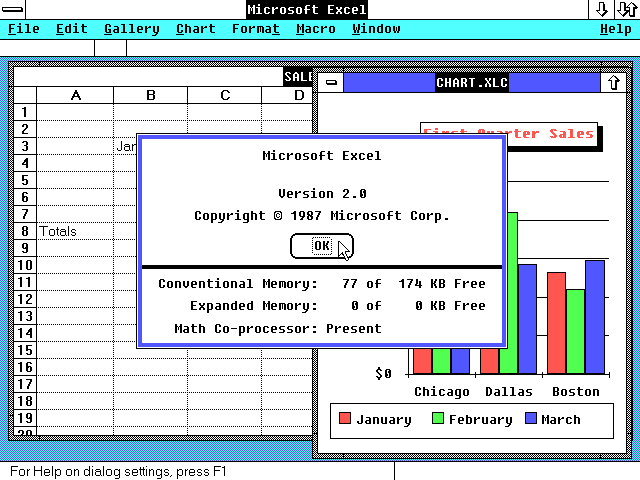
Microsoft Excel 2.0 About Dialog (1987)
Source: winworldpc.com
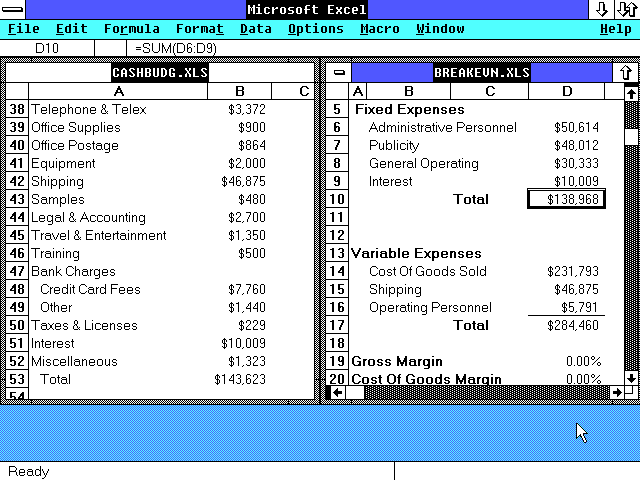
Microsoft Excel 2.0, Two Workbooks Open at Once (1987)
Source: winworldpc.com
Worksheets are already .XLS files on disk, but charts are a separate document type kept in a window of their own, .XLC. And here is the break-even analysis again, carried over from the Mac in EGA color.

Microsoft Excel 2.0 Charts and Graphs (1987)
Source: winworldpc.com
Microsoft Excel 3.0 for Windows (1990)
Excel 3.0 is where the toolbar turns up: a strip of small pictures under the menus, with a Σ for AutoSum and drawing tools for lines, rectangles, ovals and arcs. That row previews the toolbar-heavy Office interface of the 1990s.
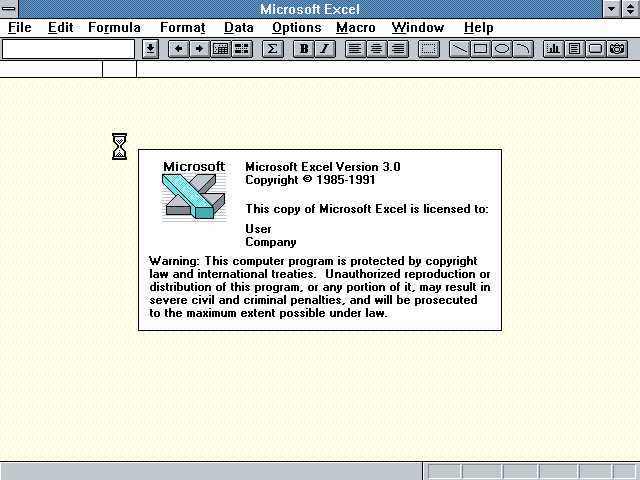
Microsoft Excel 3.0 Splash Screen (1990)
Source: winworldpc.com
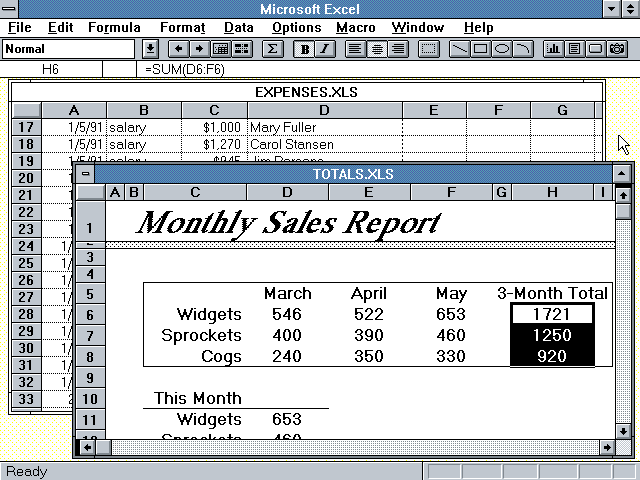
Microsoft Excel 3.0, Two Workbooks Open at Once (1990)
Source: winworldpc.com
The last one here is a guided tour macro, and the marketing copy inside the software has aged into poetry. Packed with features that will add more power to your analysis and more pizzazz to your output. The pizzazz is the 3-D bar chart on the purple field behind it.

Microsoft Excel 3.0 Charts and Graphs (1990)
Source: winworldpc.com
Microsoft Excel 4.0 for Windows (1992)
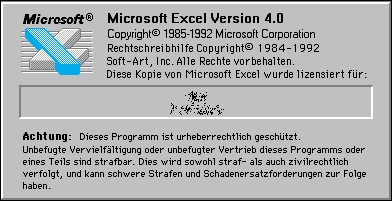
Microsoft Excel 4.0 Splash Screen, German Edition (1992)
Source: winworldpc.com
Compare this About box with the one from 1987. Available Memory: 46822 of 47290 KB Free. Five years, and the same dialog has gone from 174 kilobytes to roughly 46 megabytes. Behind it sits a Solver sample about shipping goods from plants in South Carolina, Tennessee and Arizona. The spreadsheet was now something you pointed at an optimization problem.
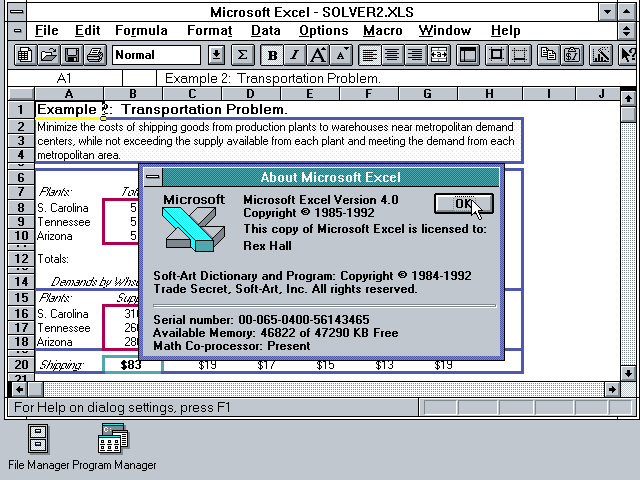
Microsoft Excel 4.0 About Dialog, over a Solver Sample (1992)
Source: winworldpc.com
The sales tracker does something easy to miss. Rows 1 and 2 are frozen at the top as a bank of on-sheet buttons labeled Print and View, and then the sheet jumps to row 98.

Microsoft Excel 4.0 Spreadsheet with Frozen Panes (1992)
Source: winworldpc.com
In EXOTIC EXCURSIONS, the chart sits directly on the worksheet, beside the numbers feeding it, instead of in a document of its own.
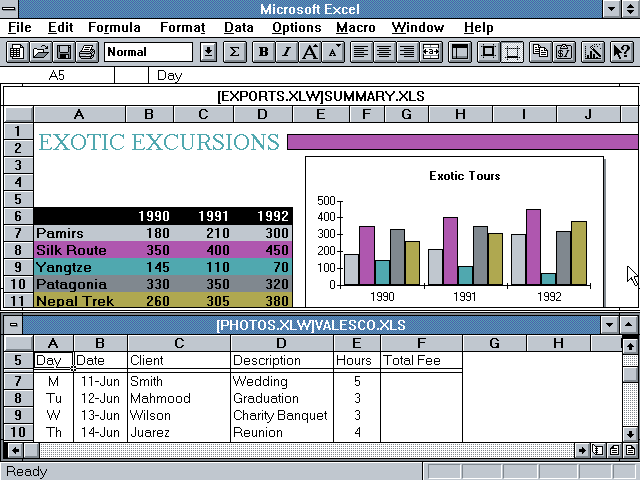
Microsoft Excel 4.0 Charts and Graphs (1992)
Source: winworldpc.com
Microsoft Excel 5.0 for Windows (1993)
A perfect artifact of 1993: a Memphis-style scatter of math art. In this application, two enormous things had changed.

Microsoft Excel 5.0 Splash Screen (1993)
Source: winworldpc.com
The first change runs along the bottom edge below. Tabs. Blue Sky, Far East 1, Far East 2, Trips. Until now a workbook
held one sheet, and a second sheet meant a second window. Sheet tabs turned the spreadsheet into a binder, and they
have not moved since.
The second change is the menu bar: File, Edit, View, Insert, Format, Tools, Data, Window, Help. That order became familiar
across Microsoft Office and lasted in Excel until the Ribbon arrived thirteen years later.
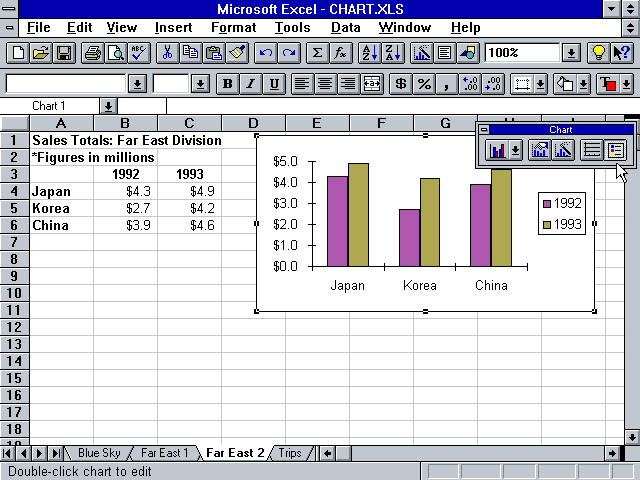
Excel 5.0 Charts, Sheet Tabs and the New Menu Order (1993)
Source: winworldpc.com
This is one of the reasons Excel outlasted most of its early rivals (along with Microsoft's enormous market power). Excel 5.0 was the first Microsoft application to ship Visual Basic for Applications. What is on screen is a real code module, under a Run menu offering Step Into and Toggle Breakpoint. Breakpoints. In a spreadsheet.
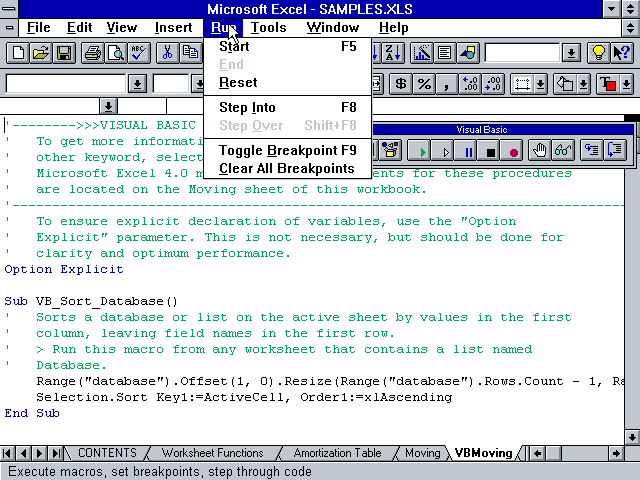
Microsoft Excel 5.0 Visual Basic (VBA) Editor (1993)
Source: winworldpc.com
Excel 95 (1995)
Excel 95 is version 7.0, and the splash says so. There was no version 6, because Word had already reached 6.0 and Microsoft wanted the whole suite carrying one number. This was also the first 32-bit release, built for the brand-new Windows 95 sitting behind it.

Excel 95 Splash Screen, Version 7.0 (1995)
Source: winworldpc.com
Down in the status bar below, in small gray type, it says Sum=0. That running total of whatever you have selected is one of the most used features Excel ever shipped, and it lives in the least valuable real estate on the screen.
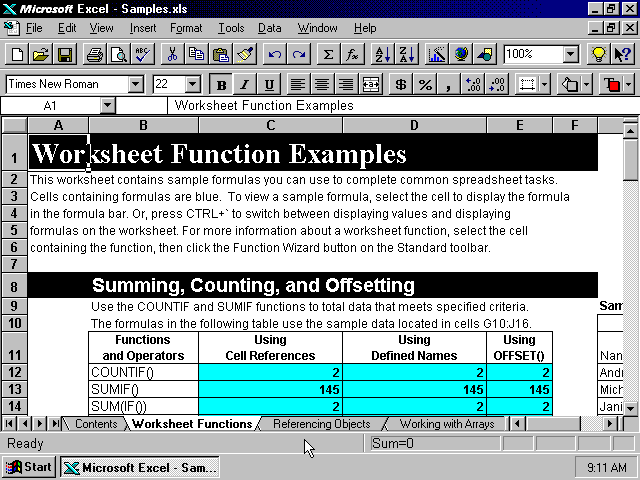
Excel 95 Worksheet Function Examples (1995)
Source: winworldpc.com
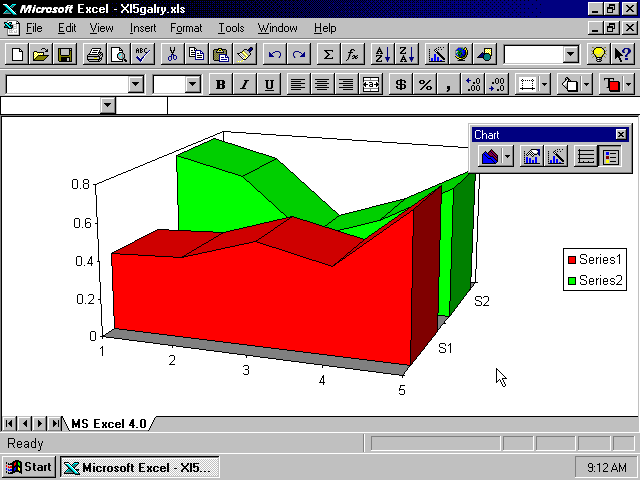
Excel 95 Charts and Graphs, Straight Out of the Sample Gallery (1995)
Source: winworldpc.com
Excel 97 with Clippy (1997)
Office 97 brought the Office Assistant, and Excel got him too. In the About dialog he is parked in the bottom left corner in a window of his own; two screenshots later he has a lightbulb over his shoulder, meaning he has thought of something.

Excel 97 Splash Screen (1997)
Source: winworldpc.com
Read the credits while you're here. Microsoft Map Program. Copyright 1995-1996 Mapinfo Corporation. For a few releases Excel could draw a shaded map of your data, licensed in from a mapping company. Mapping comes back at the bottom of this page in a form nobody in 1997 would have believed.
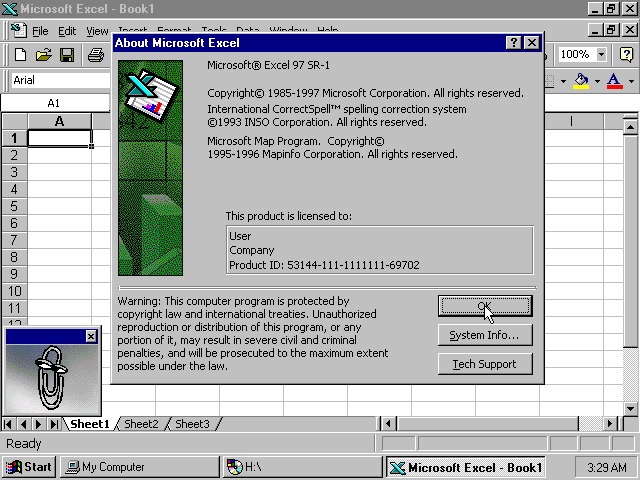
Excel 97 About Dialog, with Clippy in the Corner (1997)
Source: winworldpc.com
Excel 97 also raised the sheet limit to 65,536 rows, and that number went on to have a long career. In October 2020, Public Health England delayed reporting and contact tracing for 15,841 positive COVID-19 cases because its automated process used the old .xls format and the rows ran off the end of the file.

Excel 97 Solver Sample with Clippy (1997)
Source: winworldpc.com
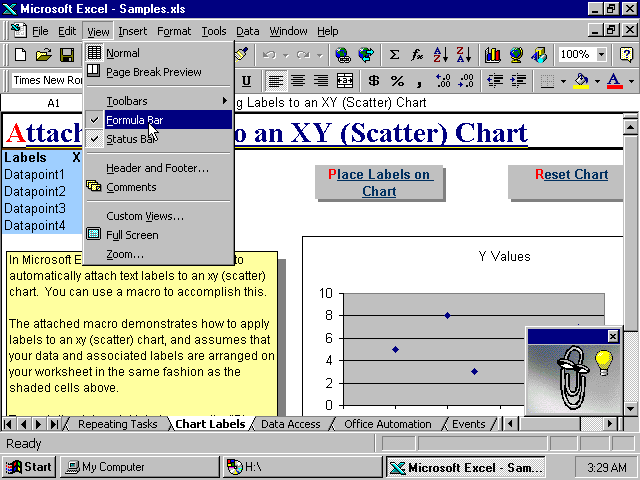
Excel 97 Charts and Graphs, with Page Break Preview (1997)
Source: winworldpc.com
Excel 2000 (2000)
The Excel 2000 splash is the plainest thing in this article. White field, green band, small icon, done.

Excel 2000 Splash Screen (2000)
Source: sourceforge.net
Look at the far right of the menu bar below. ASAP Utilities. That is a third-party add-in, and from here on you will find other people's names in Excel's menus in nearly every real-world screenshot on this page: QuickBooks, Adobe PDF, Acrobat, Foxit, ABBYY. Nobody announced it, but the spreadsheet had become a platform.
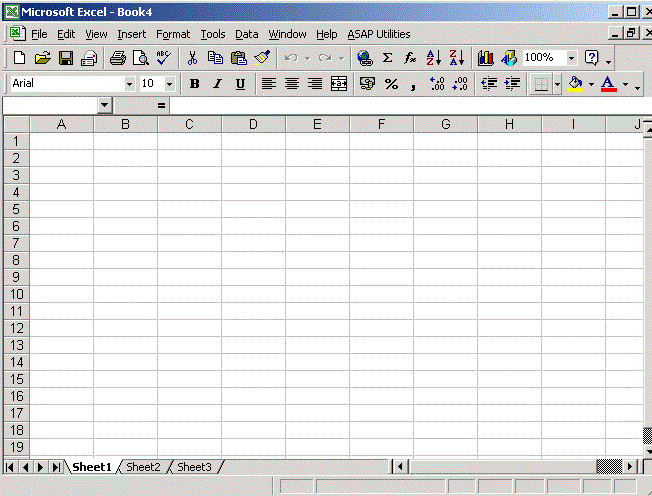
Excel 2000 Empty Sheet, with a Third-Party Add-In Menu (2000)
Source: thewindowsclub.com
This next one really interesting, and not because it's pretty. A German copy of Excel with a .DBF database
open around row 39,800, holding the international shortwave radio schedule, including a run of rows labeled
Chinese Jammer aimed at Voice of America Mandarin. Half the columns are too narrow, so they show ######## instead
of numbers.
Being in the wild has consequences. Excel's habit of converting anything that resembles a date got so bad in
genetics, where SEPT1 kept becoming 1-Sep, that the committee that names human genes gave up and
renamed the genes instead.

Excel 2000 with a 39,000-Row .DBF File Open, German Edition (2000)
Source: ilgradio.com
Below is the default palette of the era: lavender, maroon and pale cream on a gray plot area. Those three colors are the visual signature of a conference room between roughly 1997 and 2006.
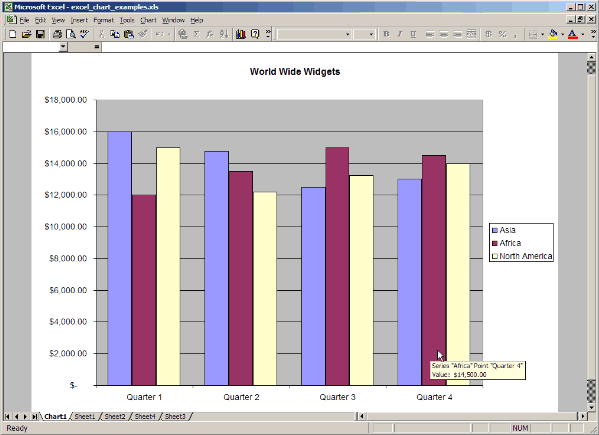
Excel 2000 Charts and Graphs (2000)
Source: gcfglobal.org
Then the Data menu: Run Saved Query, New Web Query, New Database Query, Import Text File. A web query in 2000 meant pointing Excel at a page and pulling a table straight out of it.
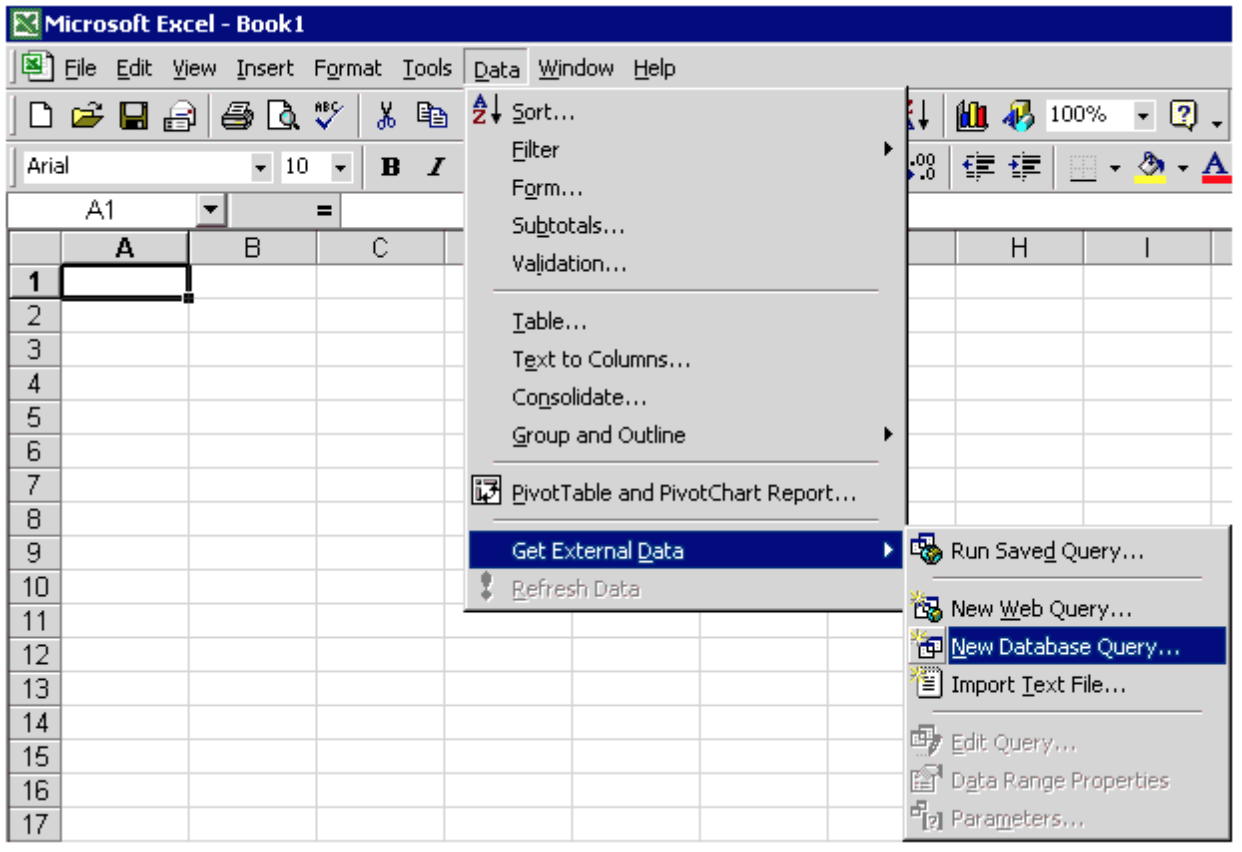
Excel 2000 Data Menu, Get External Data (2000)
Source: microfocus.com
And Page Setup, a reminder of what all of this was still for. Margins in inches, header and footer distances, center on page horizontally and vertically. The output was paper.
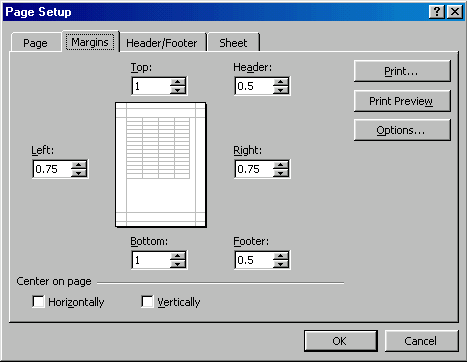
Excel 2000 Page Setup Dialog (2000)
Source: gcfglobal.org
Excel v.X for Mac (2001)
Office v. X for Mac shipped in November 2001, rebuilt for Mac OS X, with branding to match: Excel:mac, colon and all, under a green blob that looks like it escaped from a lava lamp. The sheet beside it is pure early Aqua. See also our illustrated history of Mac OS X.

Microsoft Excel v.X for Mac Splash Screen (2001)
Source: sourceforge.net
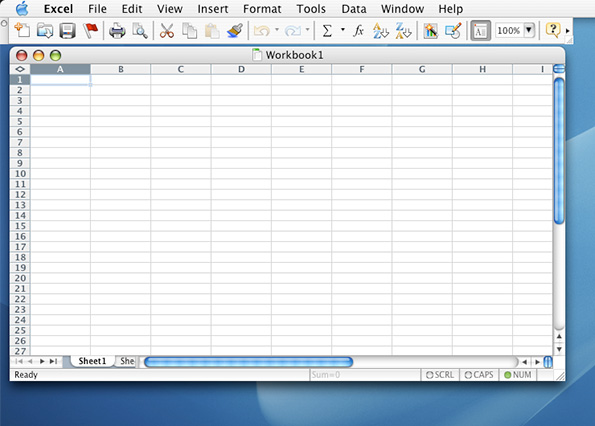
Microsoft Excel v.X for Mac Empty Sheet (2001)
Source: rosbif.net
Excel XP/Excel 2002 (2001)
Excel XP/Excel 2002 Splash Screen (2001)
Source: sourceforge.net
The screenshot below has a small story in it. A project plan full of Oracle deliverables, on a sheet named Page1-1 because it fell out of a report generator, and every date in it reads 2013. Somebody was still running a 2001 spreadsheet application twelve years later, because it worked.

Excel XP/Excel 2002 Spreadsheet, Still in Service in 2013 (2001)
Source: jazz.net
This one is better: a French workbook listing diamonds in stock, priced per carat in dollars and in francs, dated 15/02/2001. Floating over it is Volet Espions, the Watch Window, new in Excel 2002, which pinned the value and formula of a cell on another sheet so you could watch it change.

Excel XP/Excel 2002 with the Watch Window, French Edition (2001)
Source: blogspot.com
Excel 2003 (2003)
Excel 2003 Splash Page, Now Branded Microsoft Office Excel (2003)
Source: sourceforge.net
Look down the right-hand side below. That is the task pane, a whole column of the window handed to Office Online. Connect to Microsoft Office Online. Get the latest news about using Excel. Automatically update this list from the web. The application had started reaching out to the internet on its own.

Excel 2003 About Dialog and the Office Online Task Pane (2003)
Source: lowefamily.com.au
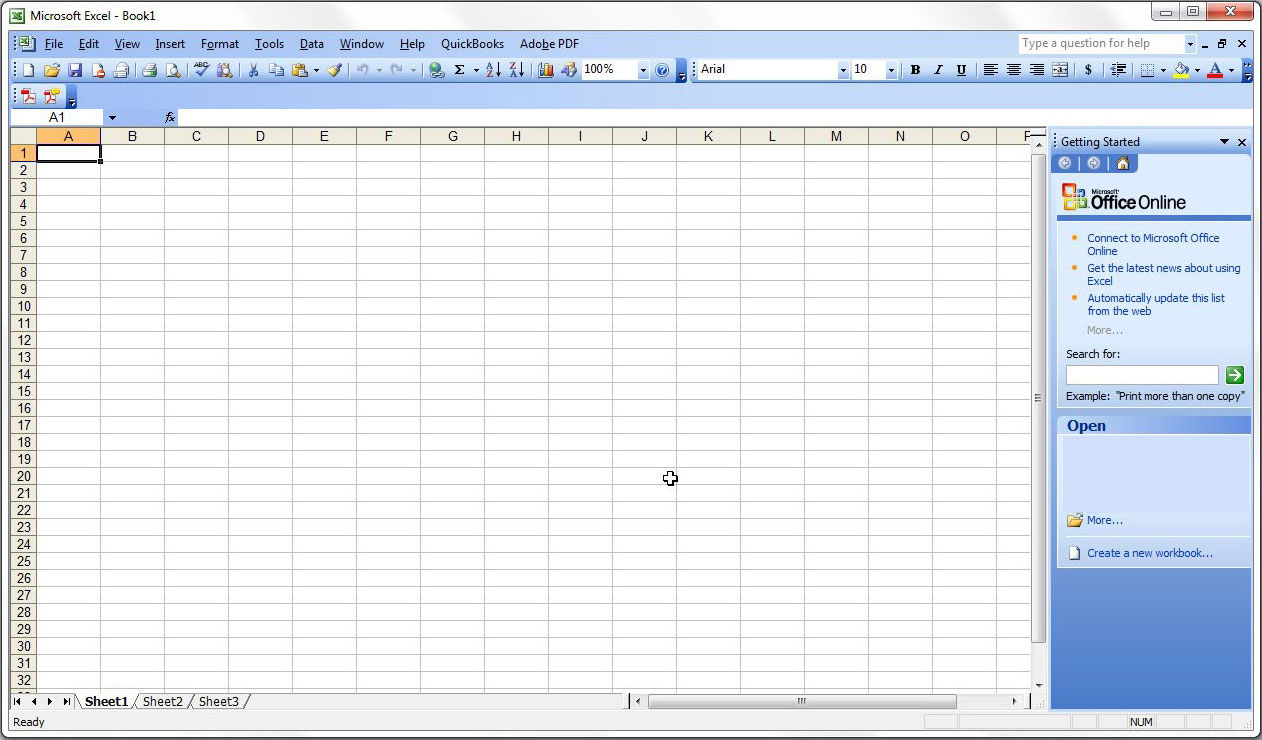
Excel 2003 Empty Spreadsheet, with QuickBooks and Acrobat Menus (2003)
Source: solveyourtech.com
The last two screenshots are the same workbook, before and after. Every day of the week gets a column, every cell holds a formula returning yes or no, and Conditional Formatting paints the ones that say yes. Note that the dialog reads Condition 1. Excel 2003 allowed exactly three conditions per cell, which explains a lot about how spreadsheets of this era look.
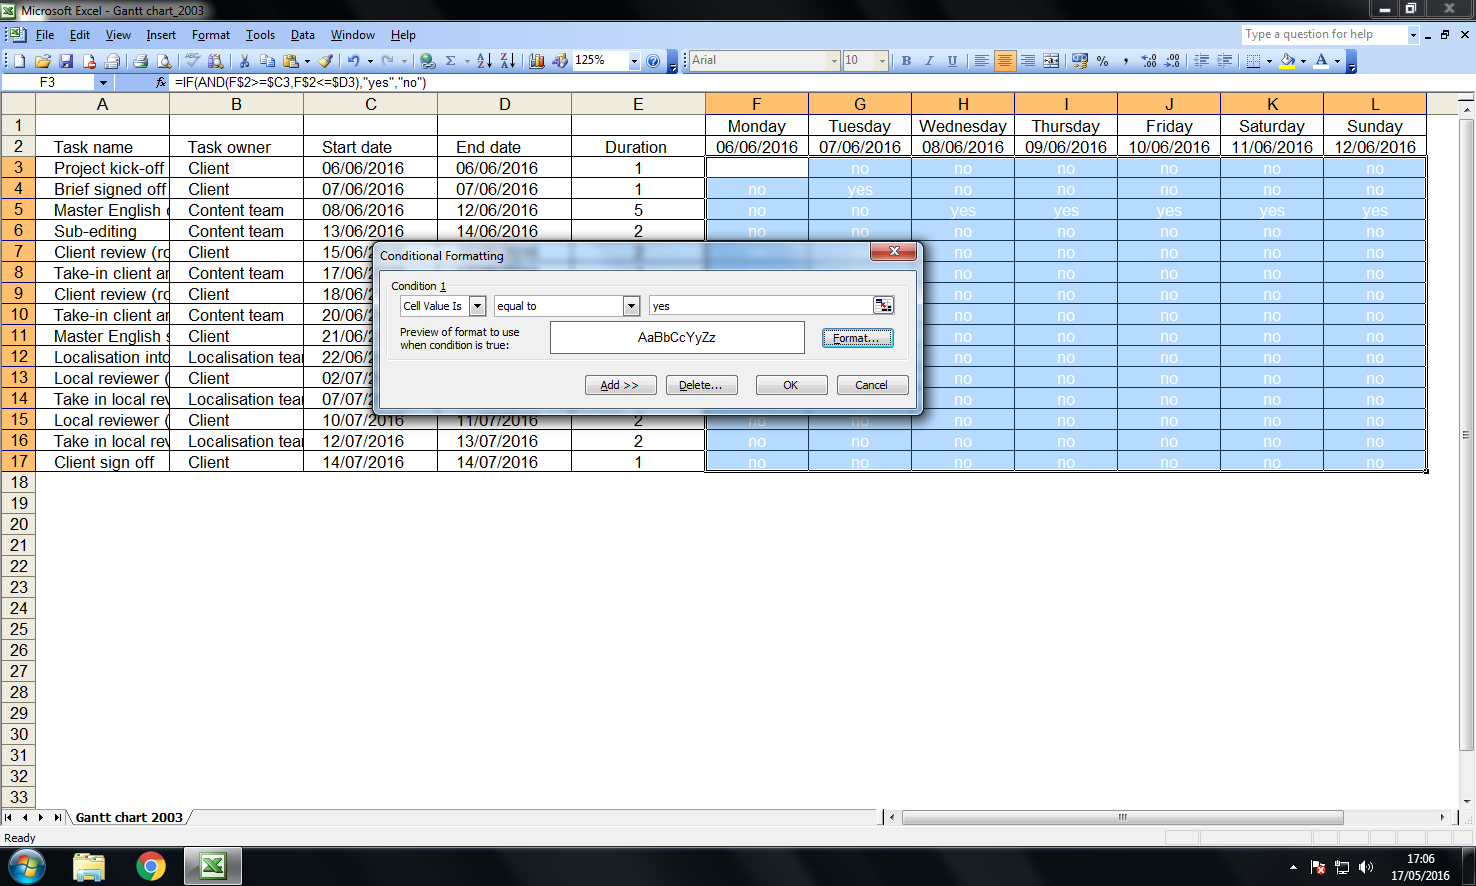
Excel 2003 Conditional Formatting, Limited to Three Conditions (2003)
Source: wrightandbrown.com
And there is the result. A Gantt chart made of red cells. Project management software existed, and it cost money. Excel was already on the machine. Hold on to this picture, because it is the last thing on this page.
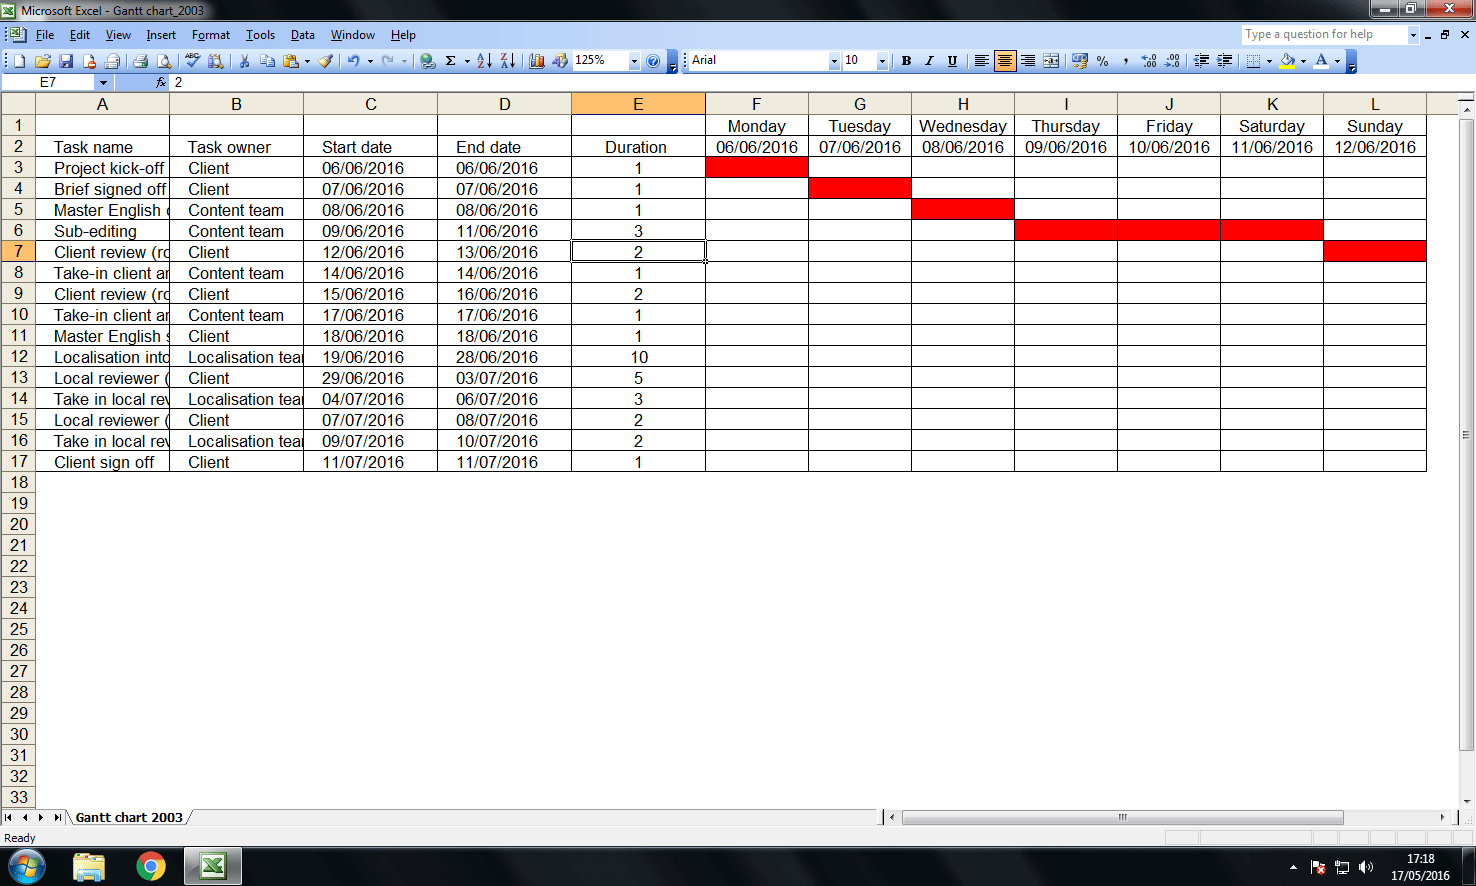
Excel 2003 Gantt Chart Built Out of Colored Cells (2003)
Source: wrightandbrown.com
Excel 2004 for Mac (2004)
The blob gets bigger and glossier. The screenshot after it is worth more. That panel down the right edge is the Formatting Palette, the Mac team's answer to a screen vanishing under toolbars: one floating inspector with collapsible sections for Font, Number, Alignment and Page Setup. It solves the problem Windows would solve three years later, in a completely different way.

Excel 2004 for Mac Splash Page (2004)
Source: sourceforge.net

Excel 2004 for Mac, the Formatting Palette and a 3-D Pie (2004)
Source: tistory.com
Excel 2007 - Ribbon Interface (2007)
This is the largest visual break in the article. The menus are gone. All of them.
In their place is the Ribbon: labeled tabs holding groups
of controls sized by how often people actually used them. Microsoft had watched its menus grow for fifteen years, to
the point where customers were asking for features the software already had, and the answer was to throw the whole
navigation model away.

Excel 2007 Splash Page (2007)
Source: sourceforge.net
Three quieter changes sit in this same empty sheet. The default font is Calibri 11 instead of Arial 10, which is why documents from either side of 2007 look subtly unalike. There is a zoom slider bottom right. And the grid went from 65,536 rows to 1,048,576, and from 256 columns to 16,384.

Excel 2007 Empty Sheet, with the New Ribbon (2007)
Source: computertutorials.in
The Russian household budget below is the new chart engine showing off: anti-aliased edges, soft gradients, bars drawn as shaded cylinders. In the formula bar, one table column is subtracted from another by name rather than by cell reference.

Excel 2007 Charts and Graphs, Russian Edition (2007)
Source: microsoft-office.biz

Excel 2007 Charts and Graphs (2007)
Source: bostonbruinsprosale.com
Excel 2008 for Mac (2008)
Office 2008 for Mac is remembered for what came out of it. VBA was dropped during the suite's transition to a universal binary for Intel Macs, and Mac offices with macro-driven workbooks were stuck until VBA returned in Office for Mac 2011, released in October 2010. What went in is the strip under the toolbar: the Elements Gallery, tabs that unroll into a scrolling rack. A ribbon in everything but name.

Excel 2008 for Mac (2008)
Source: sourceforge.net
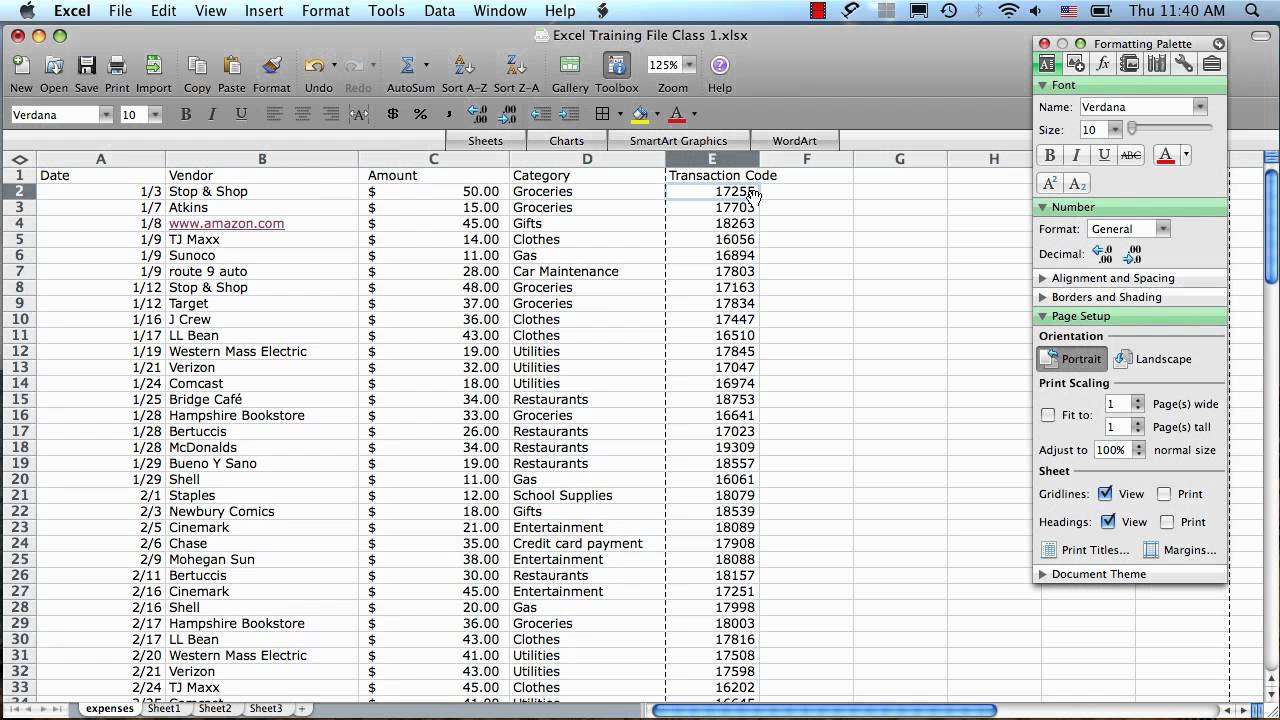
Excel 2008 for Mac Spreadsheet and Elements Gallery (2008)
Source: Hampshire College/YouTube
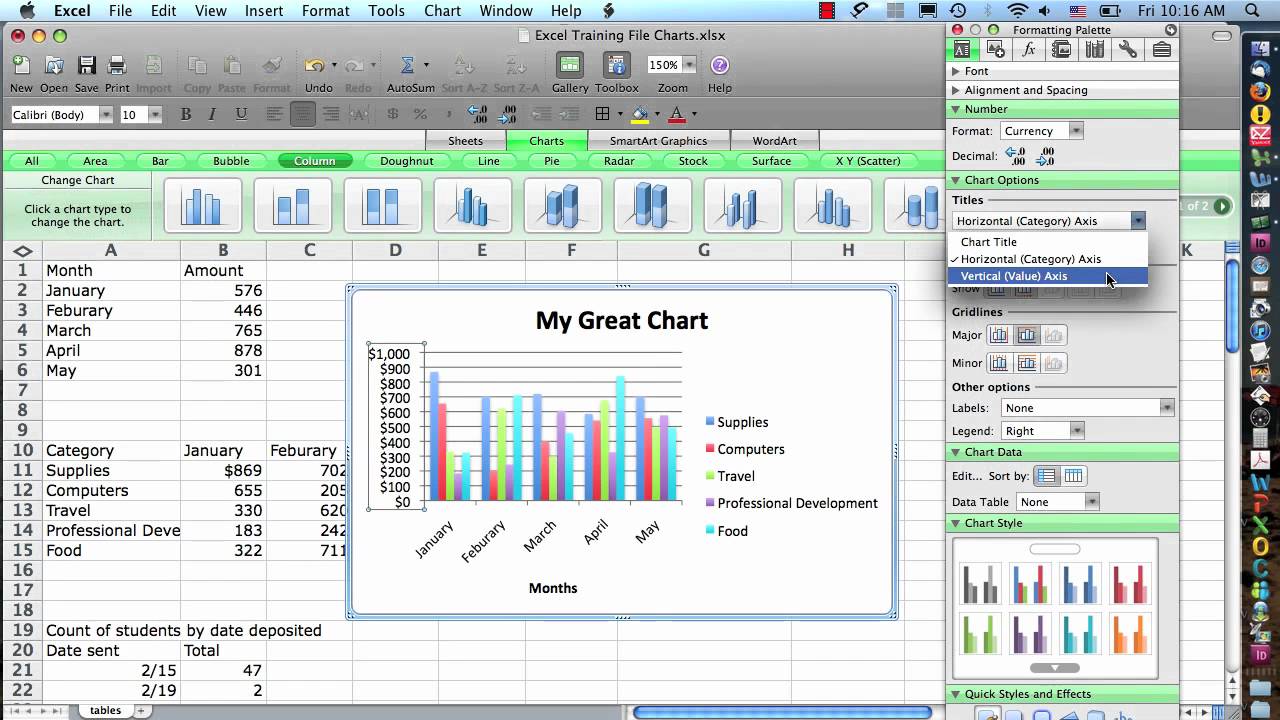
Excel 2008 for Mac Charts and Graphs (2008)
Source: Hampshire College/YouTube
Excel 2010 (2010)
The round Office button lasted exactly one release. In 2010 it becomes a green File tab that drops you into a full-screen Backstage view rather than a menu.

Excel 2010 Splash Page (2010)
Source: sourceforge.net
The title bar below is doing a lot of work: Book1 [Compatibility Mode] - Microsoft Excel non-commercial use. Compatibility mode means an old .xls file is open. The rest indicates a Home and Student license, which Microsoft restricted to noncommercial use.
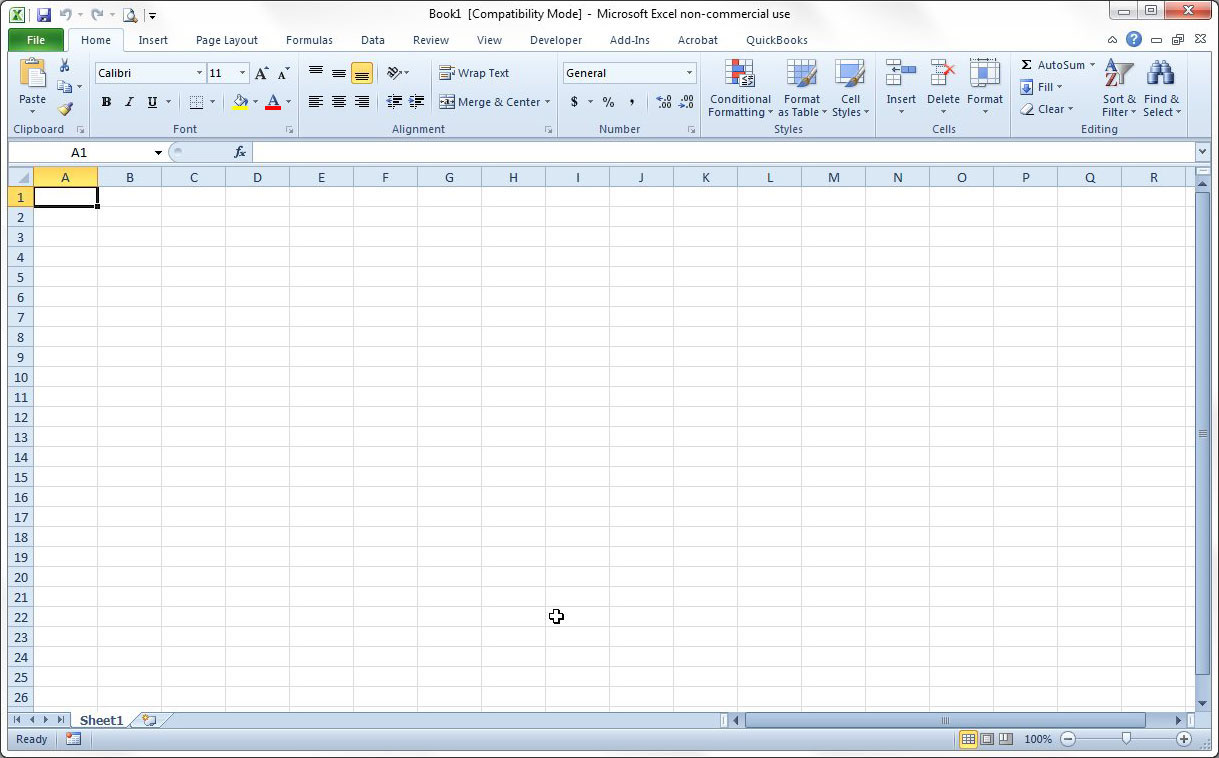
Excel 2010 Empty Sheet in Compatibility Mode (2010)
Source: solveyourtech.com
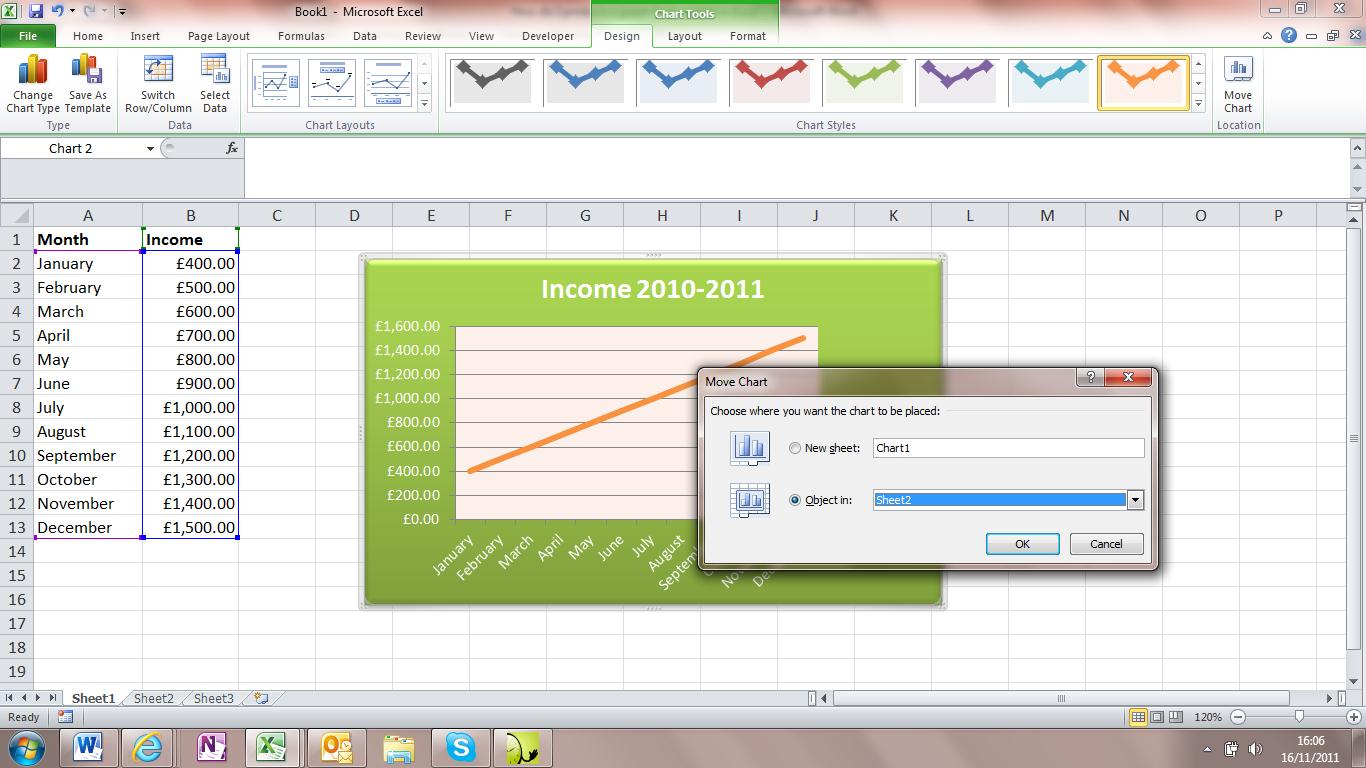
Excel 2010 Charts and Graphs, with Contextual Chart Tools (2010)
Source: vapromag.co.uk
This is where 2010 gets ambitious. The green PowerPivot tab is an add-in with a columnar database engine behind it, able to hold millions of rows outside the sheet entirely, and the two panels floating over the workbook are slicers, the big friendly filter buttons that arrived in this release. The dataset going through all that machinery is somebody's anime soundtrack collection.

Excel 2010 Power Pivot with Slicers (2010)
Source: infoworld.com
Excel 2011 for Mac (2010)
The blob retires in favor of a glassy X, and the Ribbon finally lands on the Mac. VBA came back in this release too.

Excel 2011 for Mac (2010)
Source: sourceforge.net

Excel 2011 for Mac Empty Spreadsheet, with the Ribbon (2010)
Source: enacademic.com
The Adventure Works budget is a catalog of everything Excel had learned about drawing very small pictures inside cells. Actual Totals has data bars growing behind the numbers. Quarterly Trend holds red sparklines, a complete line chart per cell. A table row can now carry a number, a bar, a trend and a verdict, and still fit on a printed page.

Excel 2011 for Mac with Data Bars and Sparklines (2010)
Source: thewwwblog.com
Excel 2013 (2013)
Windows 8 arrived and Excel went flat. No gradients, no bevels, no shadows, hairline gridlines, ribbon tabs shouting in capitals.

Excel 2013 Splash Screen (2013)
Source: sourceforge.net
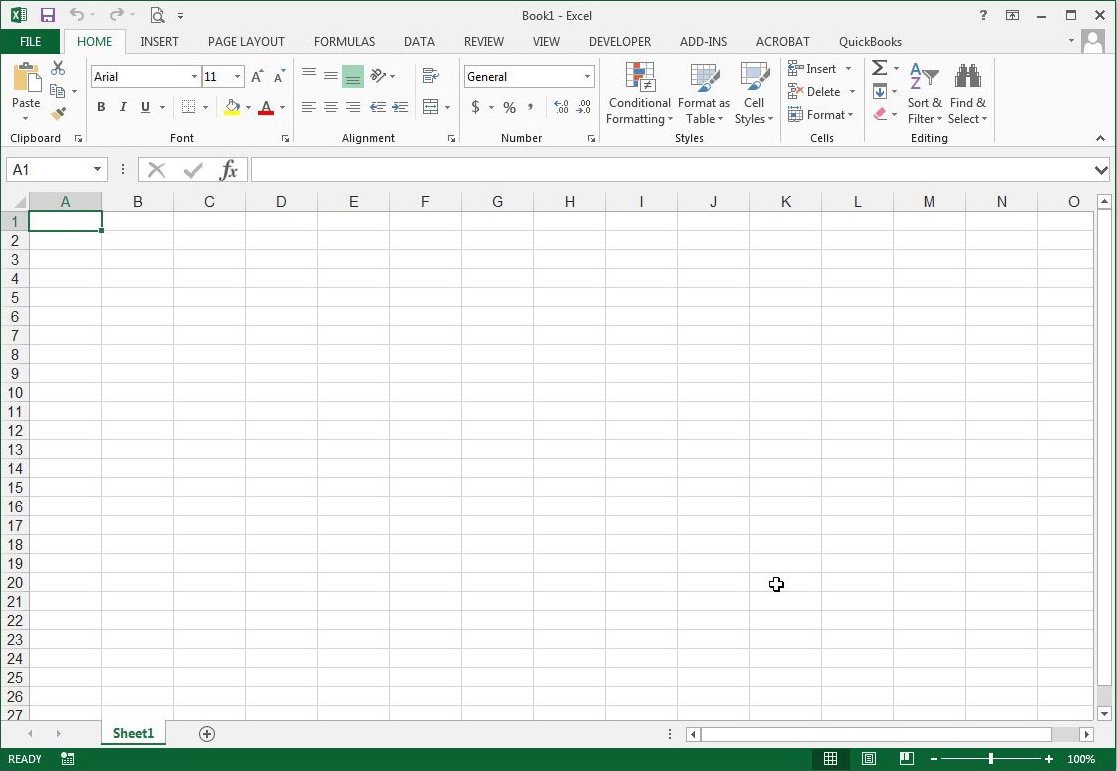
Excel 2013 Empty Sheet, Flattened (2013)
Source: solveyourtech.com
The bigger change is below. By default, Excel now opens into a start screen rather than an empty grid: recent files on the left, template thumbnails on the right, and in the top corner, Sign in to get the most out of Office. Twenty-eight years in, the spreadsheet wants to know who you are.

Excel 2013 Start Screen and Recent Documents (2013)
Source: directionstraining.com
A separately installed Power Query add-in pushed Excel farther in the same direction: From Web, From File, From Database, From Azure, and a Power BI group over on the right. The grid had become a front end for data living somewhere else.
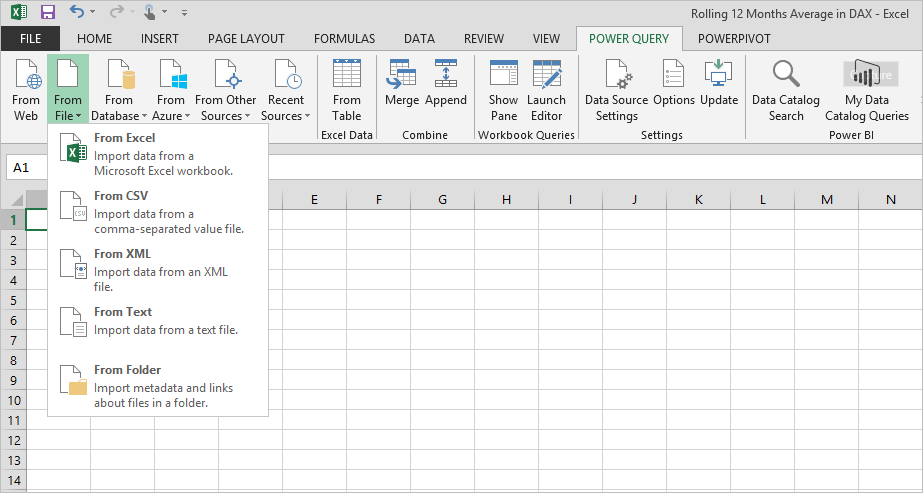
Excel 2013 Power Query, Importing From Anywhere (2013)
Source: microsoft.com
And this one, from 2015, shows how far that went: a PivotTable driven by a DAX model, a dialog for setting red, amber and green thresholds against a target, and a PowerPivot window open behind it all. A reporting stack wearing a spreadsheet as a coat.

Excel 2013 Pivot Table KPIs (2015)
Source: microsoft.com
Excel 2016 (2016)
Every file visible in this Recent list lives on OneDrive, with the account name, email address and photograph printed across the top corner.
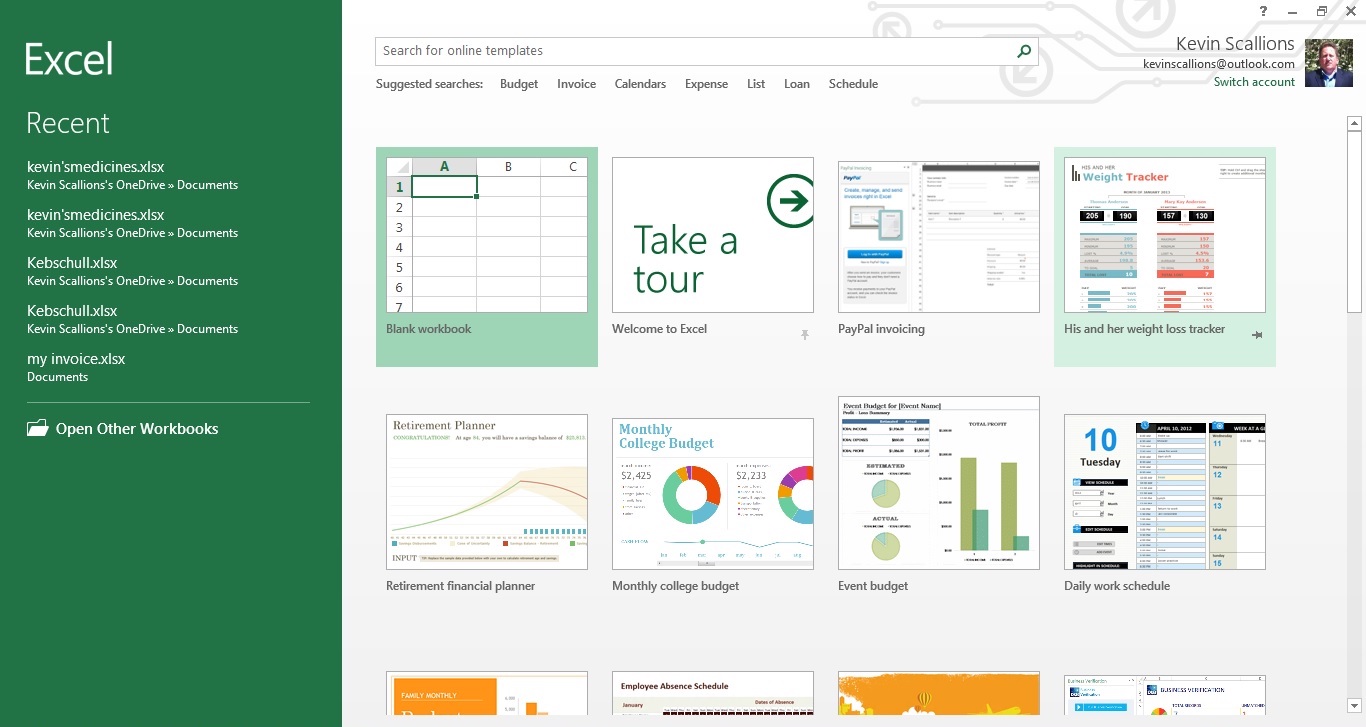
Excel 2016 Recent Documents, Stored on OneDrive (2016)
Source: kevinsitinfo.com
Color returns to the title bar, the tabs go back to mixed case, and two new things appear at the end of the row. Tell me what you want to do is a box you type a command into rather than hunting for it in the Ribbon, which is a quiet admission about the Ribbon. Beside it, a Share button.

Excel 2016 Empty Sheet, with Tell Me and Share (2016)
Source: superuser.com
Then this. Still Excel. Also a 3-D flythrough of Dallas on a Bing basemap, every building extruded to its square footage and colored by the decade it was built. Down the left is a storyboard of six-second scenes, and the Ribbon offers Create Video. The thing that started as a grid of numbers on a Compaq will now render an animated documentary about zoning.
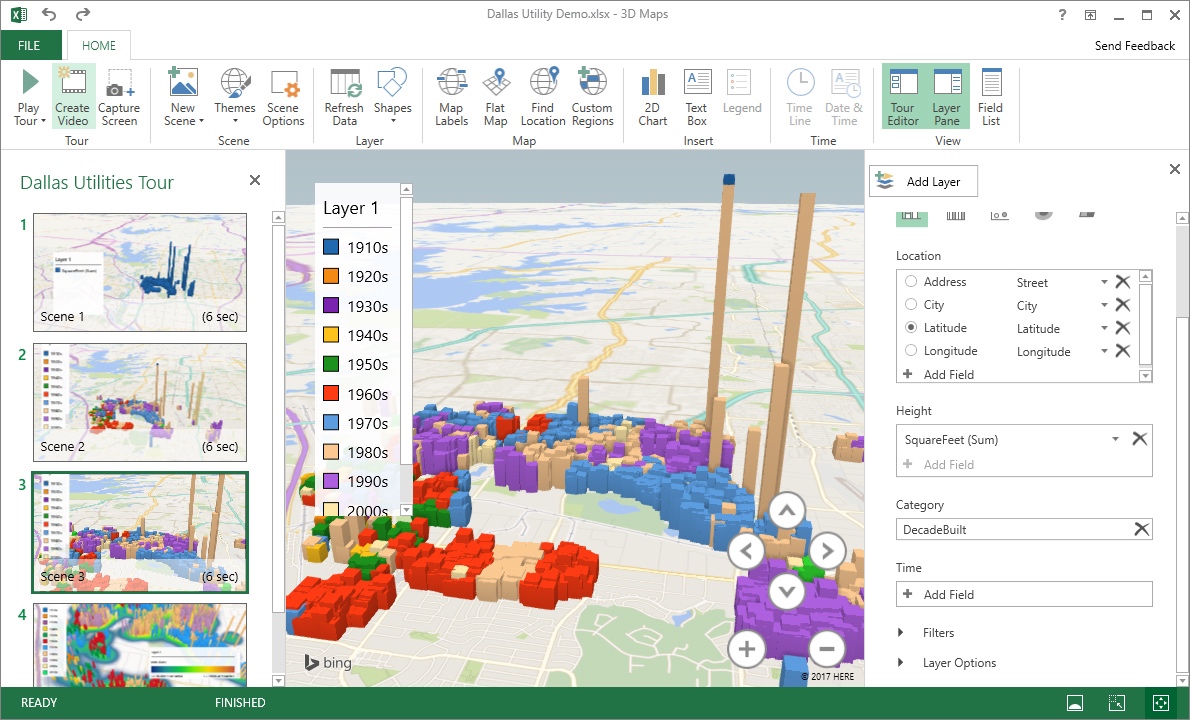
Excel 2016 3D Map, a Flythrough of Dallas Utility Data (2016)
Source: computerworld.com
And on the Mac, the Formatting Palette has finally given way to a task pane docked on the right, the same shape Windows had used since 2013. The two platforms look like each other again. The sheet is an all-time Winter Olympics medal table (with East Germany and Czechoslovakia still on it!).
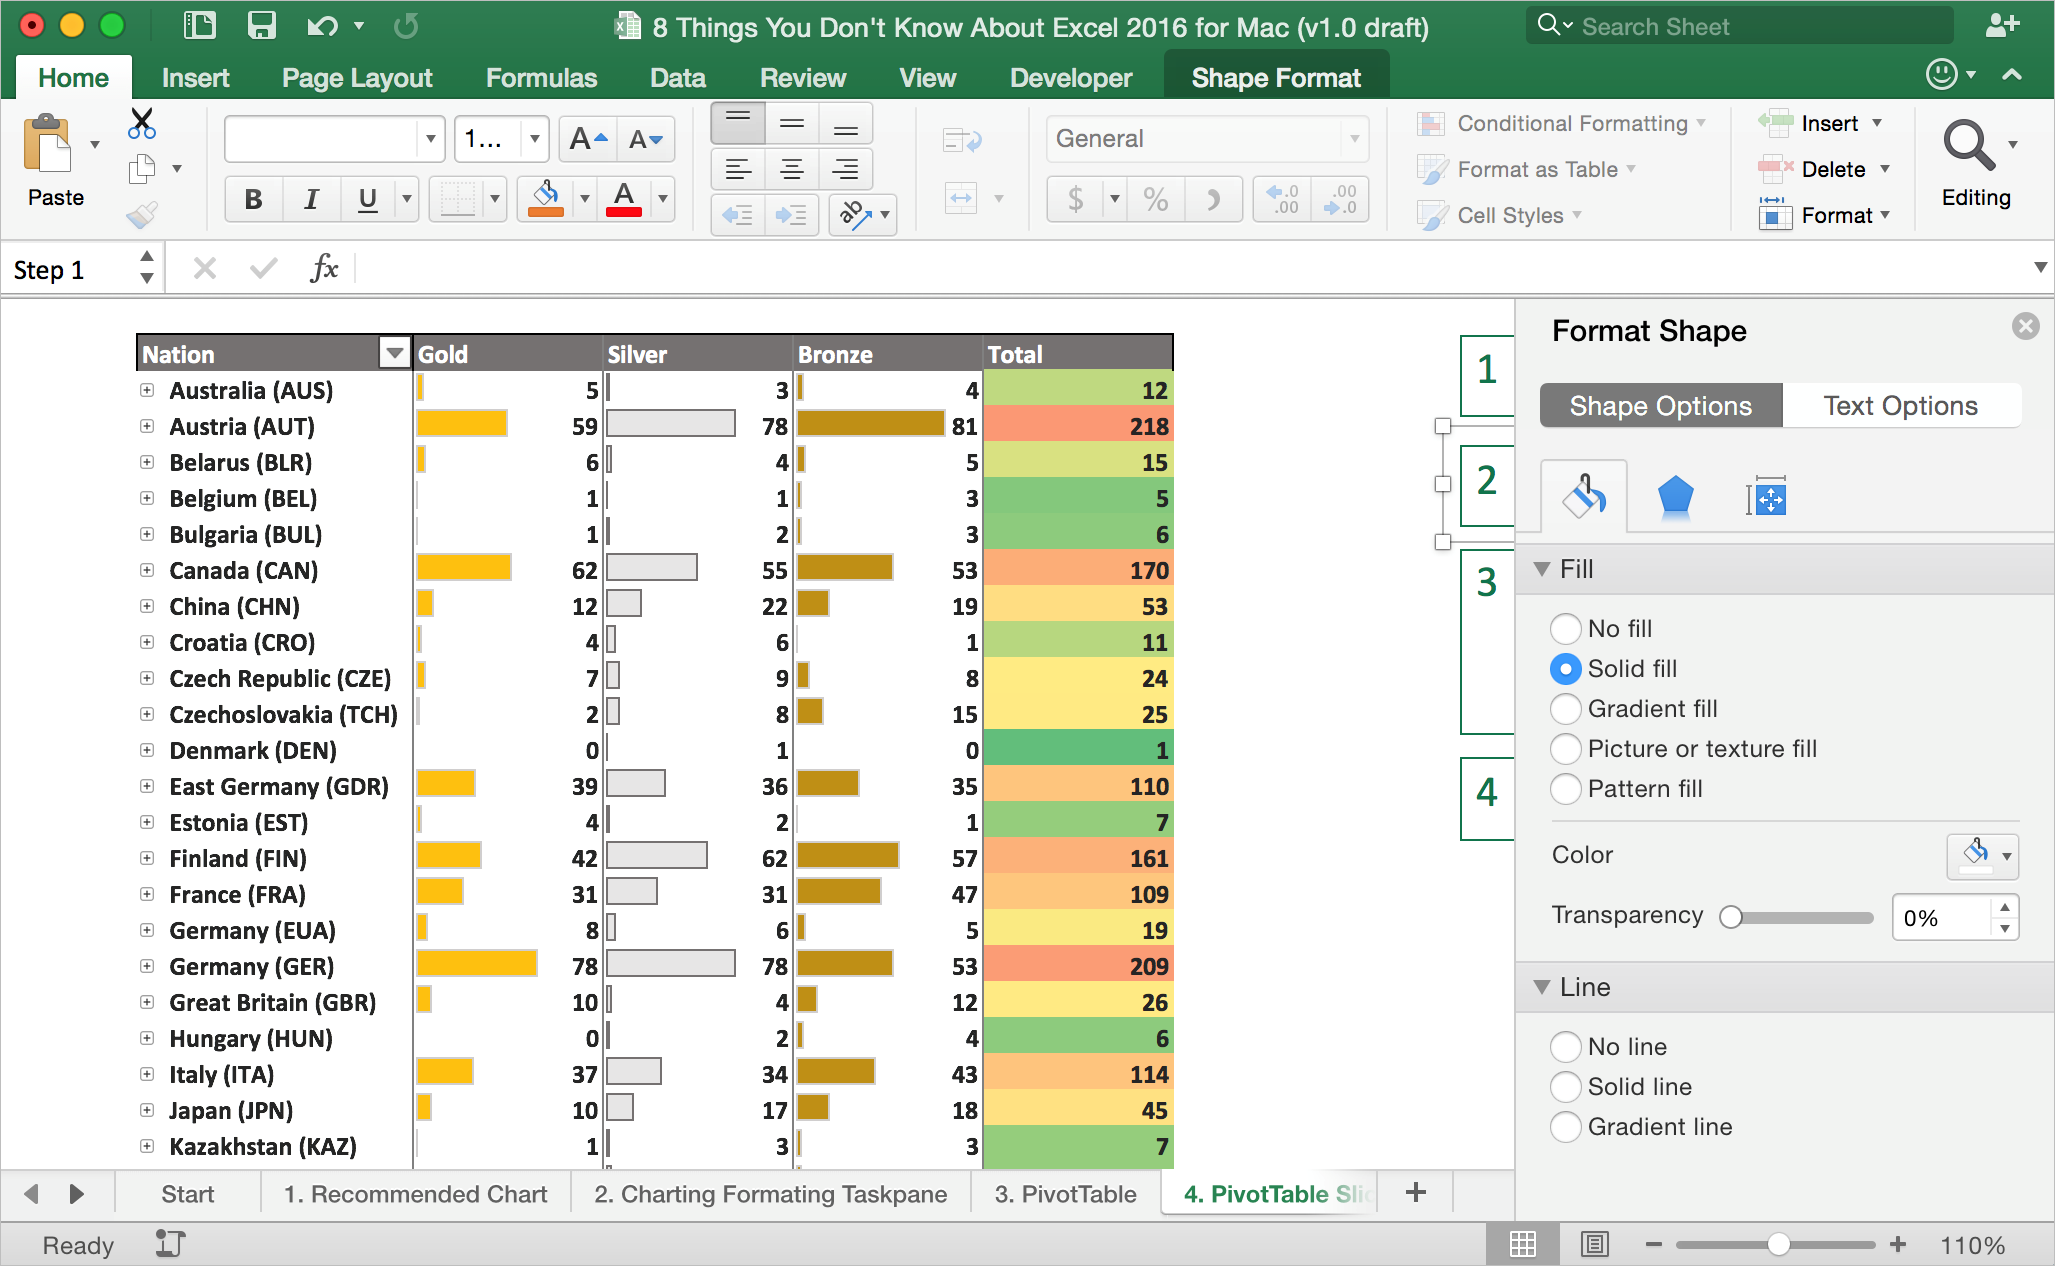
Excel 2016 for Mac with a Docked Task Pane (2016)
Source: microsoft.com
Excel for the Web, Office 365 (2019)
Excel, running in a browser tab. A waffle menu in the corner, a Recent list where every file shown sits on OneDrive, and a footer offering Accessibility, Privacy and Cookies, Legal, Trademarks. Thirty-four years after the Macintosh version, there is nothing to install.
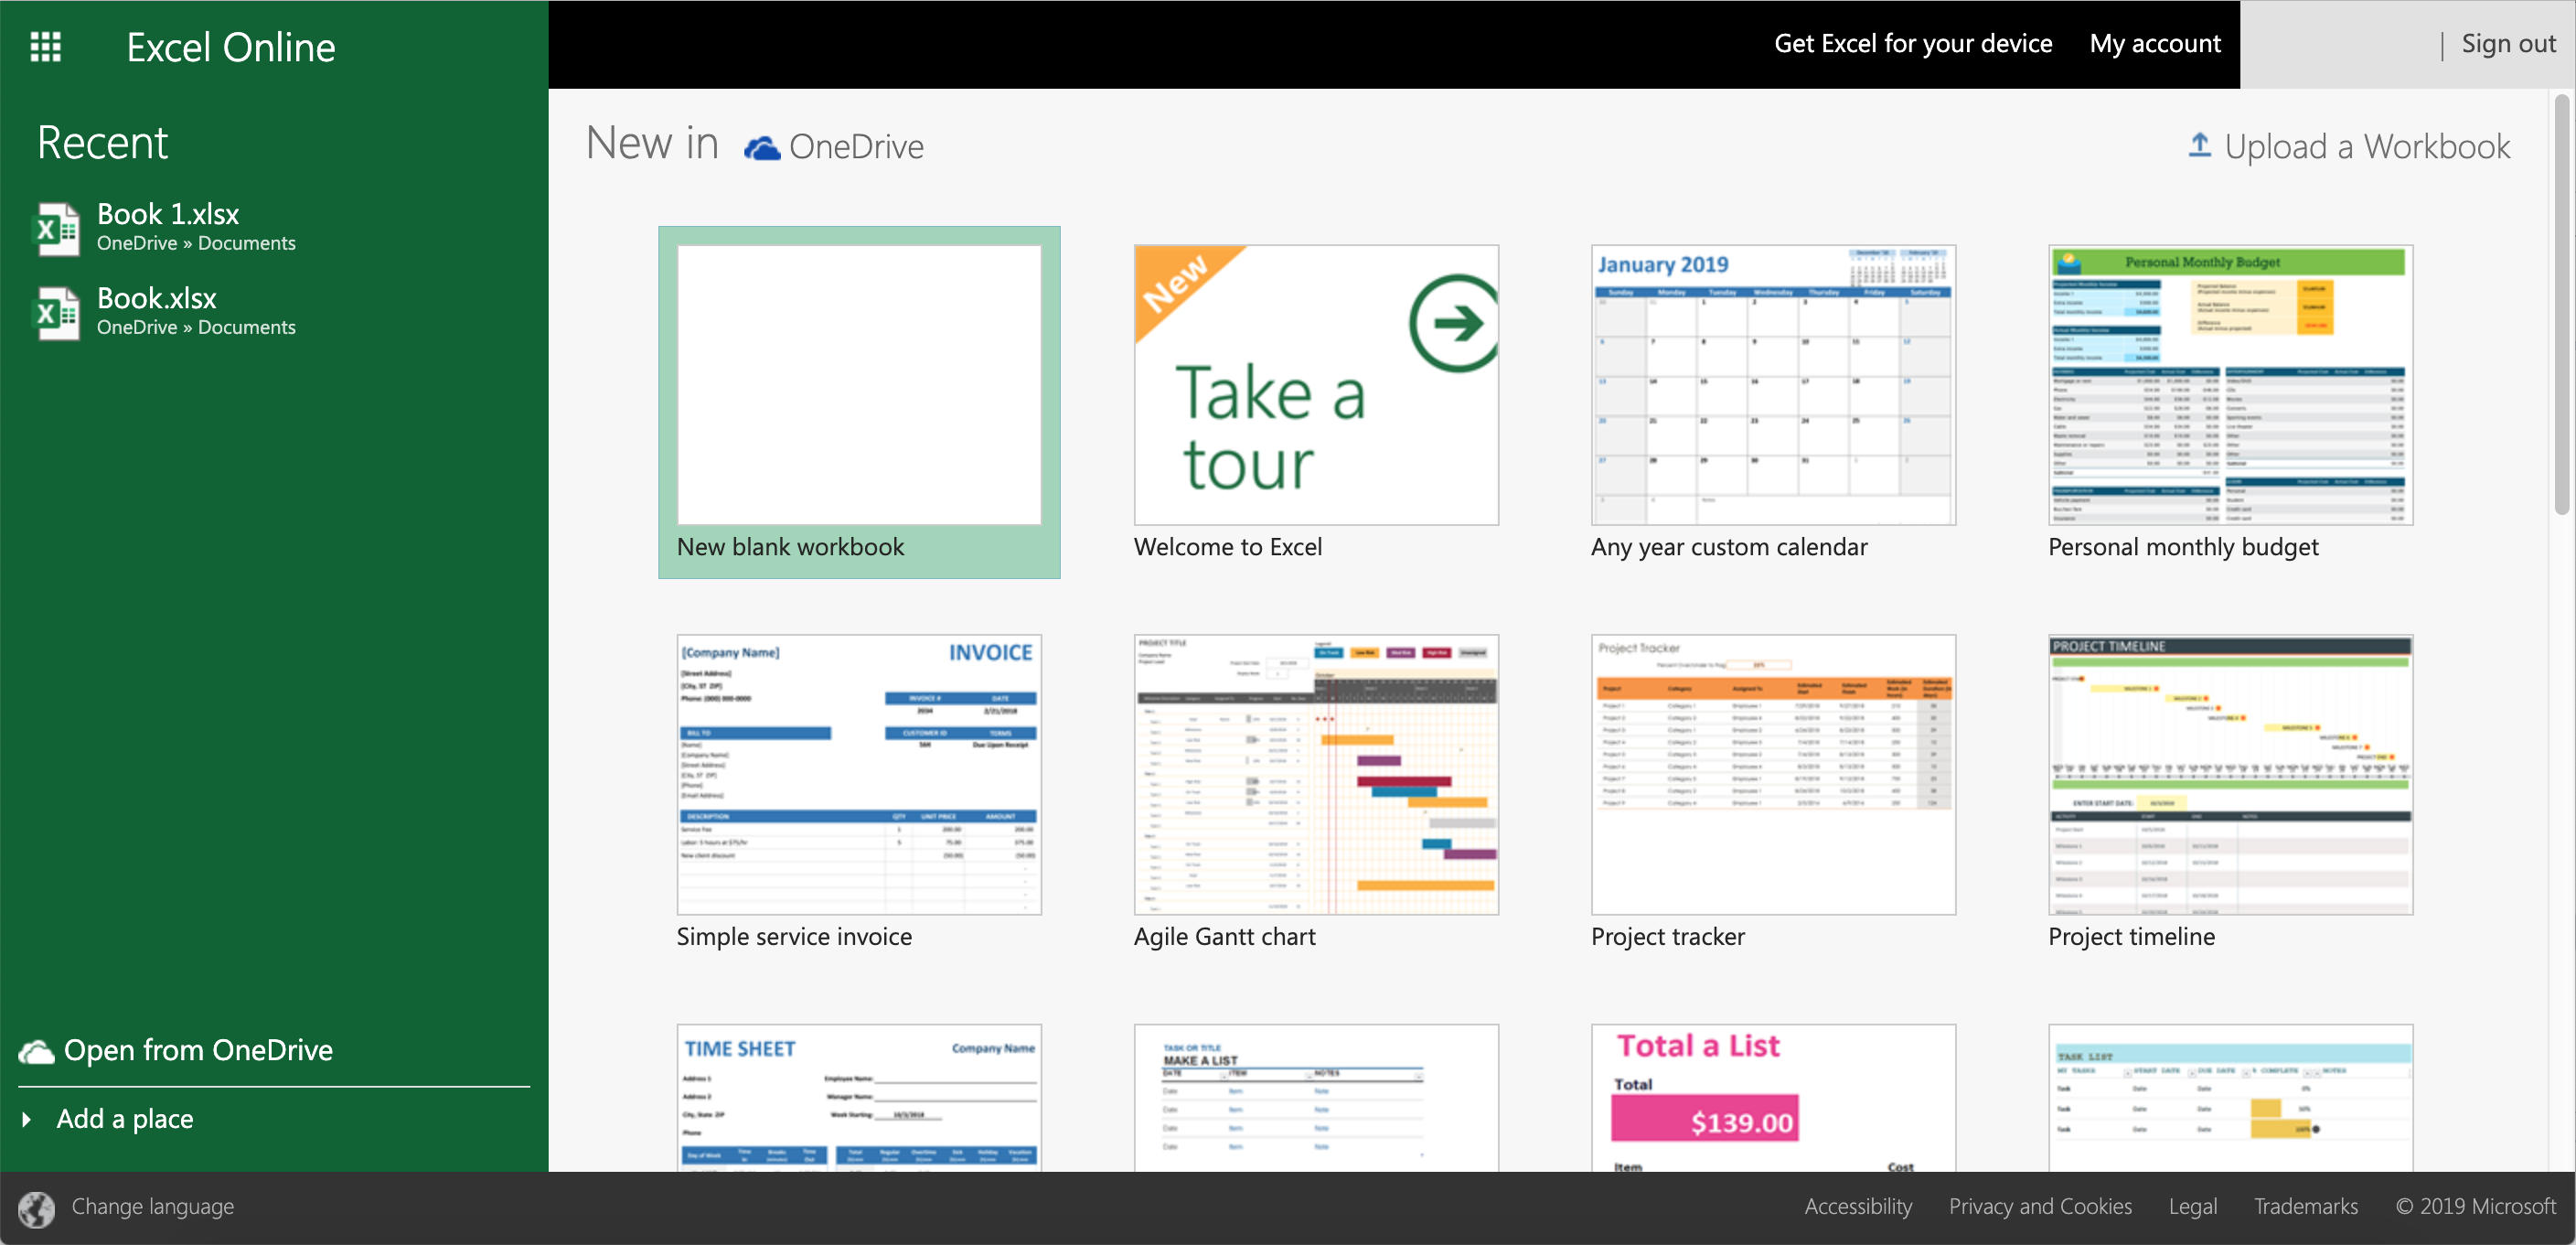
Office 365 Excel Recent Documents (2019)/Screenshot by Version Museum, captured at office.com in 2019
In the next screenshot the file name is followed by a single word: Saved. There is no visible Save button because the workbook saves automatically. At the end of the Home tab is a lightning bolt marked Ideas, which read your data and proposed charts at you.
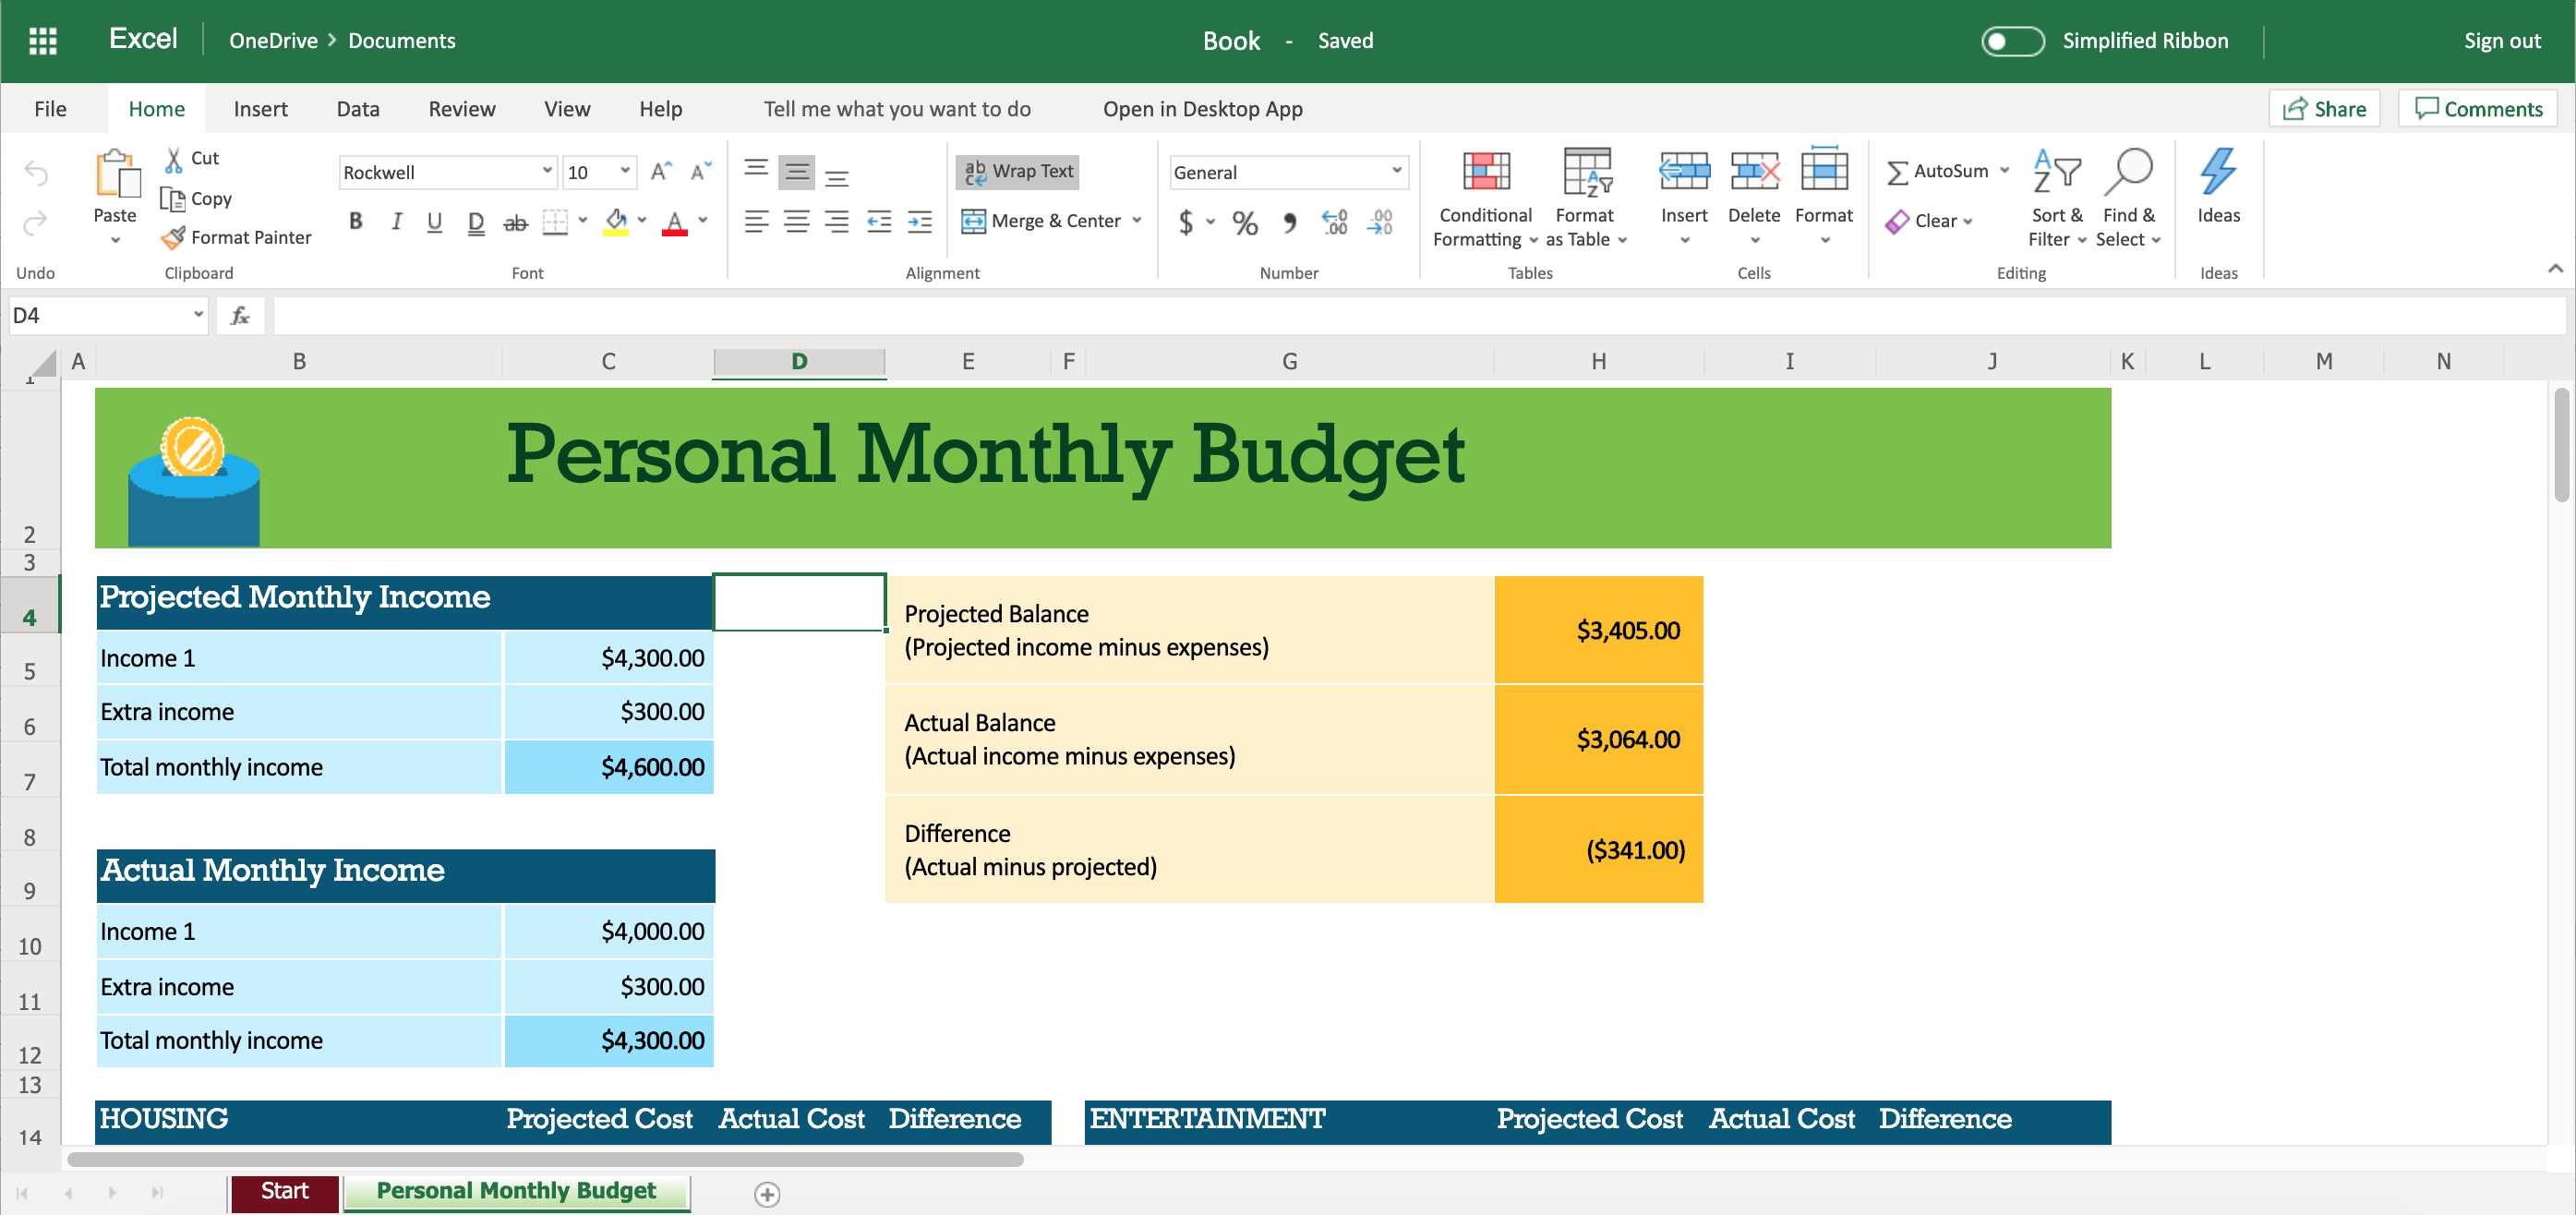
Office 365 Excel with Autosave and the Ideas Button (2019)/Screenshot by Version Museum, captured at office.com in 2019
And then the last screenshot, which is why I wanted to finish here.
It's a Gantt chart -- made of colored cells. On Track in blue, Low Risk in amber, High Risk in dark red, running in a
web browser and saving itself to a server as it goes.
Now scroll back up to Excel 2003 and look at the picture there. Sixteen years, a new rendering engine, a new file
format, a new interface and a move to the cloud, and people are still coloring in cells until the schedule appears.
The container kept changing, but the habit never did.

Office 365 Excel Gantt Chart, Still Made of Colored Cells (2019)/Screenshot by Version Museum, captured at office.com in 2019
More from Version Museum
 More from Version Museum
Microsoft Word
Continue with Excel's closest Office companion in the museum. View the exhibitPopular exhibits
Please help support our museum hosting costs by making a small donation -- buy us a coffee! Thank you so much!
 Buy us a coffee!
Scroll up to the top.